From pandemic shutdowns to Houthi attacks in the Red Sea to the sweeping tariff escalations of 2025, the past six years have delivered a relentless series of supply chain stress tests — and 2026 is adding new pressures. The organizations that have navigated each wave share a common characteristic: they invested in supply chain resilience before they urgently needed it. This guide provides the practical framework, updated for today's procurement environment.
A Timeline of Disruptions: 2020-2026
The chemical industry has endured an unprecedented concentration of supply chain shocks in a short span of years. Each event exposed different vulnerabilities, and taken together, they offer a comprehensive stress map of global chemical procurement.
COVID-19 Factory Shutdowns (2020-2021)
The pandemic’s impact on chemical supply chains began in Hubei Province, China — home to a significant cluster of pharmaceutical intermediate and fine chemical manufacturers — in January 2020. When lockdowns spread globally, the cascade effect was staggering. The American Chemistry Council estimated that U.S. chemical output fell 3.6% in 2020, the steepest decline since the 2008 financial crisis. Indian API production, which depends on Chinese intermediates for roughly 70% of its raw material inputs, was hit particularly hard. Lead times for common pharmaceutical intermediates stretched from 4-6 weeks to 16-24 weeks. Spot market prices for some specialty chemicals surged 200-400% above contract levels as buyers scrambled for available inventory.
The deeper lesson was not about the pandemic itself but about the hidden concentration risk in chemical supply chains. Many procurement teams discovered that their “diverse” supplier base actually converged on the same upstream raw material sources. Three or four nominally independent suppliers might all be sourcing the same key intermediate from the same Chinese province.
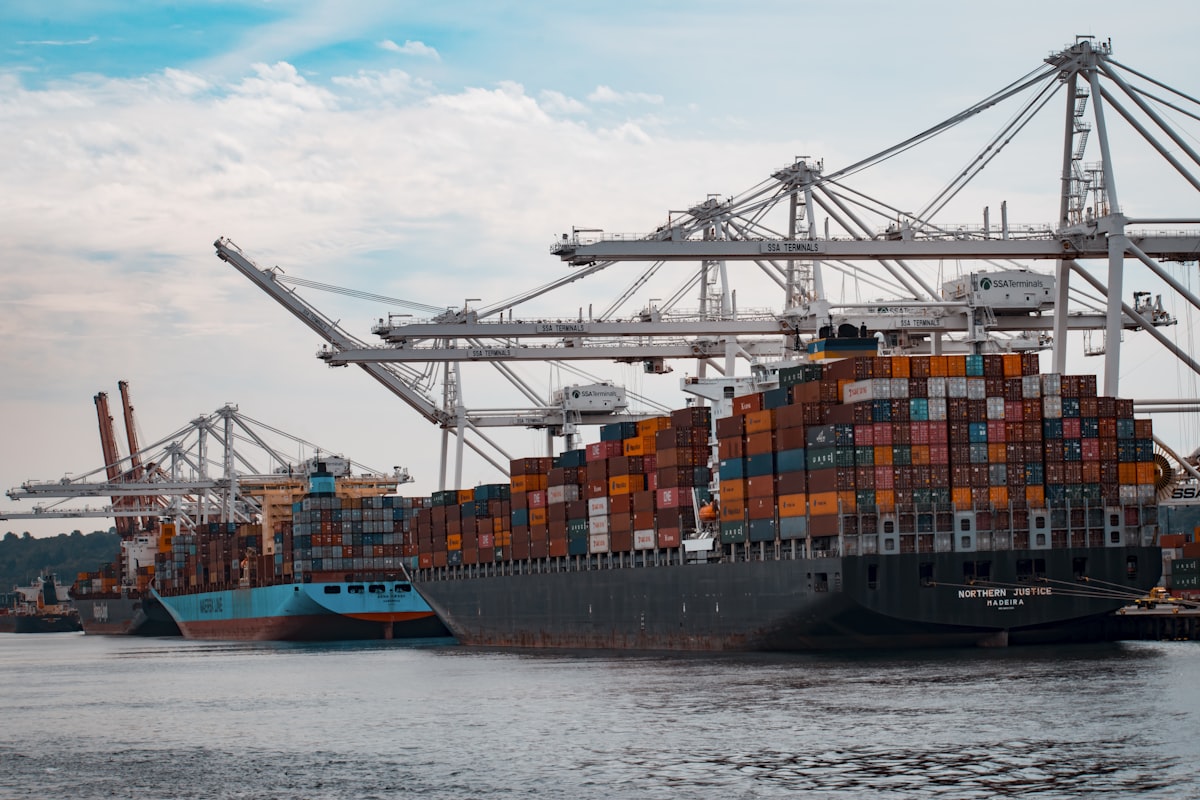
Suez Canal Blockage (March 2021)
The six-day grounding of the Ever Given in the Suez Canal blocked approximately 12% of global trade. For the chemical industry, the immediate effect was the delay of an estimated 9.6 billion dollars worth of goods per day. But the longer-term impact came from the ripple effects: vessel schedule disruptions persisted for months, container availability was thrown into chaos, and port congestion at destination terminals created secondary delays. Chemical shipments that were already in transit when the blockage occurred arrived at destination ports to find berth queues of 1-3 weeks — meaning temperature-sensitive and time-critical materials faced degradation risks they were never designed to withstand.
Texas Winter Storm Uri (February 2021)
Winter Storm Uri caused an estimated 80% of Texas petrochemical capacity to shut down for days to weeks. Texas produces approximately 40% of U.S. petrochemicals and a substantial share of global commodity chemical supply. The production losses were estimated at $29 billion across the U.S. chemical sector. Polyethylene, polypropylene, and ethylene oxide were among the hardest-hit products, with force majeure declarations cascading through the supply chain. The event demonstrated that domestic supply chains are not immune to disruption — geographic concentration within a single country can be just as dangerous as international concentration.
Port Congestion Cascades (2021-2022)
At the peak of post-pandemic port congestion, over 100 container vessels were anchored off the ports of Los Angeles and Long Beach waiting for berth space. Average container dwell times exceeded 8 days, compared to a pre-pandemic norm of 3-4 days. For chemical importers, the consequences extended beyond delay: demurrage and detention charges added $500-2,000 per container in unexpected costs. Hazardous materials faced additional complications, as congested ports imposed stricter limits on the duration hazmat containers could remain on terminal.
Red Sea Shipping Crisis (2023-2024)
Houthi attacks on commercial shipping in the Red Sea and Gulf of Aden forced major container lines to reroute vessels around the Cape of Good Hope, adding 10-14 days to Asia-Europe transit times and increasing fuel costs by an estimated $1 million per round trip. For chemical supply chains linking Asian manufacturers with European and American buyers, transit times stretched by 30-40% and freight rates for some routes increased 2-3x. The disruption highlighted a fundamental vulnerability: the global chemical trade is critically dependent on a small number of maritime chokepoints (Suez Canal, Strait of Malacca, Panama Canal, Strait of Hormuz).
Red Sea Resolution and Persistent Maritime Risk (2025)
Following the Israel-Hamas ceasefire agreement in January 2025, Houthi attacks on commercial shipping declined significantly through the first half of the year, and major container lines began restoring Suez Canal routing by mid-2025. Asia-Europe freight rates retreated from their 2024 peaks — but the episode left a lasting imprint on procurement strategy. Insurers had repriced maritime risk, shippers had formalized Cape of Good Hope contingency routes, and buyers discovered the hidden cost of the 10-14 day additional transit time: higher working capital requirements and a ~$1,200/TEU fuel surcharge that persisted even after routes normalized.
The post-resolution period also exposed a secondary disruption: when capacity rushed back to the Suez route, vessel schedule reliability temporarily deteriorated as carriers scrambled to rebalance global fleets. Supply chains that had adapted to the detour experienced a second adjustment wave during normalization. The lesson for chemical procurement trends in 2026: maritime chokepoint dependency is a structural vulnerability, and Red Sea stability should not be assumed to be permanent.
Tariff Escalation Reshapes Procurement Economics (2025–2026)
The April 2025 executive order imposing broad reciprocal tariffs — including rates up to 145% on Chinese imports — fundamentally altered the landed cost economics of chemical procurement for organizations relying on Asian supply chains. A pharmaceutical intermediate priced at $2,000/kg from a Chinese supplier faced an additional $2,900/kg in tariff costs, eliminating the labor-cost advantage that had historically made offshore sourcing attractive and making domestic alternatives cost-competitive for the first time in decades.
The tariff shock accelerated reshoring decisions that had been building since 2020. By early 2026, the Reshoring Initiative reported over $750 billion in announced U.S. manufacturing investments across pharma, chemicals, and related sectors. However, capacity additions require 3-5 years of lead time — meaning demand for domestic supply significantly outpaces available capacity in the near term. Organizations that shifted sourcing strategies rapidly discovered a new constraint: domestic suppliers are increasingly capacity-constrained, and lead times for some specialty chemicals have extended from 2-4 weeks to 8-16 weeks as domestic demand surges. Proactive supplier qualification and framework agreements are now prerequisites, not options.
Quantifying the Cost of Disruption
Supply chain disruptions in the chemical sector are not just operational inconveniences — they carry quantifiable financial consequences that should inform resilience investment decisions.
- Emergency procurement premiums — Spot market purchases during supply shortages typically cost 50-300% more than contracted prices. For specialty chemicals, premiums can exceed 500%.
- Production downtime — A pharmaceutical manufacturing line shutdown due to raw material unavailability costs $50,000-500,000 per day depending on the product, not counting the opportunity cost of delayed product launches.
- Expedited freight — Air-freighting chemical shipments that normally travel by ocean adds $3-8 per kilogram in freight costs, turning economical bulk purchases into premium-priced deliveries.
- Quality re-testing — Materials delayed in transit may require re-testing before use, adding $1,000-5,000 per lot in analytical costs and 1-2 weeks in time.
- Regulatory delays — If a supply disruption affects a product on a regulatory submission timeline, the downstream cost in delayed market entry can reach millions of dollars.
When you total these costs, even a single significant disruption can exceed the entire annual investment needed to build meaningful supply chain resilience. The business case writes itself — if procurement teams calculate their actual disruption exposure honestly.
Vulnerability Assessment Framework
Building resilience begins with understanding where your vulnerabilities lie. A systematic vulnerability assessment evaluates each chemical in your procurement portfolio across multiple risk dimensions.
Criticality Analysis
Not all chemicals require the same level of supply chain protection. Classify your procurement portfolio into tiers:
- Tier 1 (Critical) — Materials where a supply interruption would halt production within days. These typically include APIs, key intermediates, and specialty reagents with limited supplier options. Invest the most resilience resources here.
- Tier 2 (Important) — Materials where disruption would cause significant inconvenience and cost but not immediate production shutdown. Common solvents, excipients, and chromatography media often fall here.
- Tier 3 (Commodity) — Widely available materials with many interchangeable suppliers. Standard lab chemicals, packaging materials, and commodity solvents. Minimal resilience investment needed.
Risk Scoring
For each Tier 1 and Tier 2 material, score the following risk factors on a 1-5 scale:
- Geographic concentration — Are suppliers concentrated in a single region vulnerable to natural disasters, geopolitical instability, or regulatory changes?
- Supplier concentration — How many qualified suppliers exist? Is qualification of an alternative supplier feasible within your planning horizon?
- Lead time exposure — How long is the typical order-to-delivery cycle? Longer lead times mean more exposure to in-transit disruptions.
- Inventory buffer — How many weeks of safety stock do you maintain relative to lead time variability?
- Substitutability — Can alternative materials or synthesis routes be used if the primary material becomes unavailable?
- Regulatory complexity — Would a supplier change require regulatory filings, revalidation, or customer notification?
The composite score identifies your highest-risk materials and directs resilience investment where it matters most.
Tiered Inventory Strategy
The just-in-time model that dominated pre-2020 chemical procurement optimized for cost at the expense of resilience. A tiered inventory strategy restores the balance by calibrating safety stock levels to material criticality and supply risk.
Calculating Optimal Safety Stock
For each material, safety stock should account for both demand variability and supply variability:
Safety Stock = Z x square root of (Lead Time x Demand Variance + Average Demand squared x Lead Time Variance)
Where Z is the service level factor (1.65 for 95% service level, 2.33 for 99%). In practice, for Tier 1 pharmaceutical chemicals, most organizations target 99% service level, translating to 6-12 weeks of safety stock depending on lead time variability.
Consider a pharmaceutical intermediate with an average monthly demand of 50 kg, a mean lead time of 8 weeks with a standard deviation of 3 weeks, and a material cost of $2,000/kg. The calculated safety stock at a 99% service level would be approximately 35 kg, representing $70,000 in carrying cost. Compare this to a conservative estimate of $250,000+ in costs associated with a single production shutdown — the safety stock investment pays for itself if it prevents even one disruption per four-year period.
Consignment and Vendor-Managed Inventory
For high-value specialty chemicals, consignment inventory arrangements can shift carrying cost risk. Under a typical consignment model, the supplier maintains physical inventory at or near the buyer’s site, and the buyer pays only upon consumption. This aligns the supplier’s interest in maintaining availability with the buyer’s desire to minimize working capital tied up in inventory. Vendor-managed inventory (VMI) programs take this a step further, with the supplier monitoring consumption rates and proactively replenishing stock based on agreed-upon minimum levels.
Supplier Diversification Methodology
Diversification sounds simple in principle — qualify more suppliers — but effective diversification requires strategic thinking about what, exactly, you are diversifying.
Geographic Diversification
The highest-impact diversification strategy is ensuring your supplier base spans multiple geographic risk zones. A procurement team with three qualified suppliers, all based in the same Chinese province, has not actually diversified. Meaningful geographic diversification means qualifying suppliers across at least two of the following zones: domestic (United States), nearshore (Canada, Mexico), Europe, and Asia. The goal is not to eliminate international sourcing but to ensure that no single regional disruption can simultaneously affect all your supply options.
Technical Diversification
For custom synthesis and specialty chemicals, technical diversification means qualifying suppliers who use different synthetic routes to the same target molecule. If your primary supplier uses a palladium-catalyzed cross-coupling route and your backup supplier uses the same route, a shortage of palladium catalysts would affect both. Qualifying a supplier with an alternative synthetic approach — for example, a copper-mediated or photochemical route — provides genuine technical diversification.
Financial Diversification
Supplier financial stability is an underappreciated risk factor. Small, specialized chemical manufacturers may offer excellent quality and responsiveness, but they may also be one bad quarter away from insolvency. Include financial health metrics in your supplier evaluation: revenue trends, profitability, debt levels, and ownership stability. A balanced supplier portfolio includes a mix of large, financially stable producers and agile smaller suppliers, with allocation weighted toward financial resilience for your most critical materials.
Near-Shoring vs. Reshoring: An Honest Analysis
The post-pandemic push toward domestic and near-shore sourcing has significant appeal, but the cost-benefit analysis is more nuanced than the most enthusiastic advocates suggest.
Advantages of Domestic and Near-Shore Supply
- Reduced transit time — Domestic lead times of 1-3 weeks versus 8-16 weeks for Asian imports
- Regulatory alignment — Shared compliance frameworks (FDA, EPA, OSHA) eliminate cross-jurisdictional regulatory complexity
- Communication efficiency — Same time zone, same language, same business culture
- Tariff and currency risk elimination — No exposure to trade policy changes or exchange rate fluctuations
- Faster issue resolution — Site visits, audits, and technical collaboration are logistically simple
Honest Limitations
- Higher unit costs — U.S. and European chemical manufacturing costs are typically 20-40% higher than Asian equivalents for commodity and intermediate chemicals. For highly specialized or complex syntheses, the gap narrows significantly.
- Capacity constraints — Domestic production capacity for some specialty chemicals is limited. Reshoring demand takes years to translate into new capacity.
- Raw material dependencies — Even domestic manufacturers may depend on imported raw materials, meaning supply chain risk is reduced but not eliminated.
The pragmatic approach is a blended strategy: domestic sourcing for Tier 1 critical materials where supply security justifies the cost premium, combined with diversified international sourcing for Tier 2 and Tier 3 materials where cost optimization is the primary objective.
Building Supplier Relationships That Survive Crises
Transactional procurement relationships — where supplier selection is driven primarily by price and purchase orders are placed through competitive bidding — are the first to fail during supply disruptions. Suppliers facing constrained capacity allocate preferentially to their strategic partners: customers who provide forecast visibility, commit to volume agreements, pay promptly, and invest in the relationship during normal times.
Key practices for building crisis-resilient supplier relationships:
- Share demand forecasts — Give suppliers 6-12 month rolling demand forecasts, updated monthly. Even approximate forecasts help suppliers plan capacity allocation.
- Establish framework agreements — Long-term supply agreements with defined volume commitments and pricing mechanisms provide mutual security. Suppliers are more likely to prioritize customers with committed volume.
- Conduct joint business reviews — Quarterly or semi-annual meetings to discuss performance, capacity planning, and market intelligence build trust and transparency.
- Pay on time, every time — Prompt payment is the simplest and most effective way to become a preferred customer. During crises, suppliers with cash flow pressure allocate inventory to customers who pay reliably.
- Invest in supplier development — Technical collaboration, quality improvement projects, and shared problem-solving create relationships that are difficult for competitors to replicate.
Measuring Supply Chain Resilience: Key KPIs
What gets measured gets managed. Establish KPIs that track supply chain resilience alongside traditional procurement metrics:
- Supplier concentration index — What percentage of total spend is with your top 3 suppliers? What percentage is single-sourced? Target: no more than 30% of critical material spend with any single supplier.
- Geographic concentration index — What percentage of supply originates from a single country or region? Target: no more than 50% of critical material supply from any single geographic zone.
- Days of inventory coverage — For Tier 1 materials, maintain a rolling metric of current inventory divided by average daily consumption. Target: minimum 30 days for critical materials.
- Supplier qualification pipeline — How many backup suppliers are in various stages of qualification? A healthy resilience program should always have qualification projects in progress.
- Lead time variability — Track the standard deviation of lead times by supplier and material. Increasing variability is an early warning signal of supply chain stress.
- Perfect order rate — The percentage of orders delivered on time, in full, and meeting all quality specifications. Declining perfect order rates signal emerging supply chain problems.
Frequently Asked Questions
What is the most important first step in building chemical supply chain resilience?
Start with a criticality analysis of your procurement portfolio. Classify every chemical into tiers based on production impact, then conduct a risk score for each Tier 1 and Tier 2 material across geographic concentration, supplier concentration, lead time exposure, and substitutability. This assessment directs your resilience investment where it matters most.
How much safety stock should I maintain for critical chemicals?
For Tier 1 pharmaceutical chemicals, most organizations target a 99% service level, which translates to 6-12 weeks of safety stock depending on lead time variability. The exact calculation accounts for both demand variability and supply variability. Compare the carrying cost against the potential cost of a production shutdown to validate the investment.
Is nearshoring always better than global sourcing for chemicals?
Not always. Domestic sourcing is strongly recommended for Tier 1 critical materials where supply security justifies any cost premium. However, for Tier 2 and Tier 3 commodity materials with many interchangeable suppliers, diversified international sourcing may still be the most cost-effective approach. The key is a blended strategy that matches sourcing geography to material criticality.
How many qualified suppliers should I have for each critical chemical?
Best practice is a minimum of two fully qualified, actively supplying sources for every Tier 1 material, spanning at least two geographic risk zones. Maintaining a 70/30 or 60/40 allocation split keeps both suppliers engaged and tested. A qualified-but-never-ordered backup supplier provides false confidence during actual disruptions.
What KPIs should I track for supply chain resilience?
Key metrics include supplier concentration index (no more than 30% of critical spend with any single supplier), geographic concentration index (no more than 50% from any single region), days of inventory coverage (minimum 30 days for critical materials), lead time variability by supplier, and perfect order rate. Tracking these alongside traditional cost metrics provides the full picture.
How ChemContract Supports Supply Chain Resilience
As a U.S.-based chemical supplier with custom synthesis, contract R&D, and analytical capabilities under one roof, ChemContract is positioned to serve as a domestic supply partner for organizations building resilience into their procurement strategy. Shorter lead times, shared regulatory frameworks, and direct communication channels address many of the vulnerability categories identified above.
ChemContract also supports supplier diversification strategies by providing secondary-source qualification services — synthesizing and characterizing materials to your specifications so that a qualified domestic alternative is ready before a disruption occurs, not in response to one. Our flexible production capabilities, from milligram-scale R&D quantities to multi-kilogram production, allow us to serve as both a development partner and a production-scale supply source as your needs evolve.
Key Takeaway
Supply chain resilience isn't about eliminating all risk — it's about building the capacity to absorb disruptions without catastrophic consequences. The investment in resilience pays dividends not just during crises, but through the day-to-day operational stability that allows procurement teams to focus on strategic value creation rather than firefighting.
Build a Resilient Supply Chain
Diversify your chemical supply with USA-based sourcing, cGMP compliance, and 2-4 week turnaround.